Digital Dashboards: Every Business Needs
Digital dashboard – or digital dashboard, is a digital interface used to collect and aggregate data of an entire organization. A dashboard typically provides in-depth business analytics, and gives a quick look at individual departmental productivity, trends, activities, KPIs etc. A digital dashboard can also be called a dashboard, traffic dashboard or traffic dash.
A good dashboard can give a company a boost. Such a dashboard, in addition to being the most important part of determining how far a team can go on the path to fame, is also an endless source of inspiration. Looking at it is also looking at the beauty of professionalism.
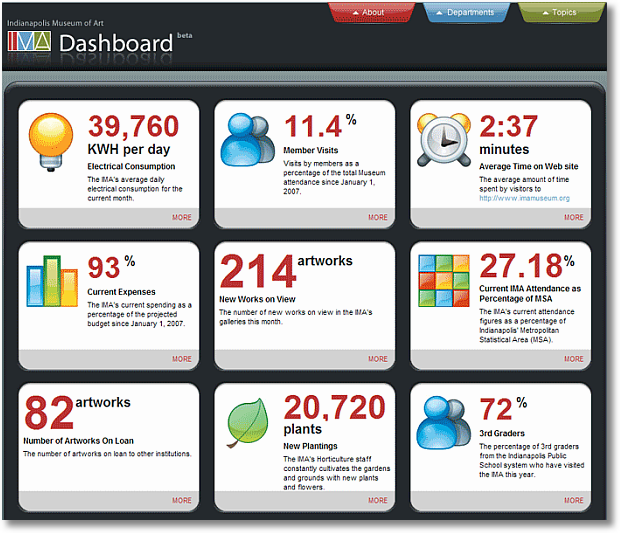
This dashboard provides an overview of the entire business in just one screen. Easy to understand and comprehensive, but not too much. The explanation is brief but essential, including the measure of each category and a few important keywords.
Dashboard brings benefits to businesses in the aggregation of data. However, many businesses do not really know how to use the dashboard effectively, overusing it creates a bunch of data.
The core problem: The failure of metrics is “just aggregate”.
There is so much data in the world, so much so that it is waiting to be seen by you. Most of the time, leaders will inevitably have a need to find someone to “synthesize” the data for them. , give them a “quick look at the matter,” or “a few bullet points.” It is a very understandable need. And that is our challenge.
Those summaries, glances, and bullet points don’t really change the job because they’re basically:
The people who worked the closest to the data, the people who actually did the most massive and complex analytical work, were just the data providers. They do not give us insight and advice.
The people who receive the compilation are incapable of understanding the complexity, will never actually do the analysis, and therefore have no basis for knowing what to do with the compilation they receive.
Solution to use Dashboard effectively.
1. Text (wisdom)
To make smart data-driven decisions, you need four things:
- You need access to the data.
- The ability to analyze key data points drawn from the operation itself.
- The ability to understand the elements that make up that process (who, what, where).
- And has the power to make decisions.
2. Insight
Don’t redefine what the numbers say. You don’t have to point out to your boss that this month’s viewership is down 4% from last month. They can see for themselves, the chart is right in front of their eyes. What they want to hear is why, what led to this decline, what they should be worried about – the underlying causes, and the reasons that affect performance. Your job is to find them.
3. Recommendations of Action – Recommendations of Actions.
How should the boss act? You could say something like this: The x parameter is decreasing because we haven’t taken advantage of the y trend and therefore I think we have to do z. Or: We didn’t meet our customer satisfaction target because our PC version website works too hard on mobile platforms, and we should create another mobile-compatible version of the website. more active. Or: Revenue increased by 48% but actual profit decreased by 80% because we were too hasty to focus on Cost Per Click, leading to an increase in sales of non-mainstream items. This problem is exacerbated by our reliance on conversion tracking tools. I suggest shifting the focus to Profit Per Click and a custom delivery model by Mr. Z.
Use language. Use your own insight. Based on the data you have gathered.
4. Business Impact – Business Impact.
One question that might be asked of you by CXOs is: If they accept your proposal and the entire company takes action, how will the business be impacted. This is the problem. Part of this is because analysts often don’t have the skills to calculate the impact of their proposed actions. The rest of the problem is that calculating the real impact requires a lot of work to be invested. However, it’s better to tell CXOs the possible outcomes when they act on your vision and suggestions, rather than giving them a sense of urgency that prompts them to act. . Not sure if that would have been better.
Your dashboard should have certain data, but it really needs to have three parts: Insight, Action, and Business Impact (IABI).
Dashboard doesn’t need to have huge tables, nor is it a place to flaunt the power of Javascript or SQL in performing large cloud queries. Dashboard needs more “language”. It needs to show your mindset, in all three of those key categories – IABI.
Instead of creating a dashboard…
We are going to create a “Customized Data Puke” (CDP). Strictly speaking in terms of meaning, what we create to serve administrators is not actually called a dashboard in its own right. The first thing to do is stop calling that thing a dashboard. It’s just a bunch of data, but has been tweaked for better use.
Therefore, for our directors, marketing leaders, campaign funders, and immediate superiors who are responsible for making decisions at the tactical level, we will give them a CDP.
They don’t have time to capture all the data, but they want to analyze it a little, dig a little, question it a little. Our CDP can fill that need, and it can be extracted directly from our digital analytics tools (which never happens with a real dashboard).
Breakthrough principles for a good dashboard:
- Dashboards are not reports. Do not cram data. Please add Insights, Insights, Recommendations for Actions, and Business Impact. Remember the IABI well.
- NEVER let bosses interpret the data themselves (let them make decisions based on your recommendations, in addition to their own intelligence and business strategy)
- When it comes to KPIs, your content pieces and recommendations should cover the entire lifecycle from start to finish.
- Please specify the context. A good dashboard uses goals, standards, and even competitive analysis to convey the context of the business.
- The basic goal of a dashboard is not to inform, not to provide knowledge. Its basic goal is action-oriented!
Reference source: Trungduc.net
Other news
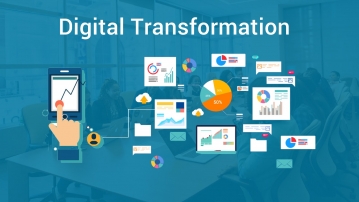
In the current context, the importance of digital transformation…

The trend of applying ERP (software Enterprise Resource Planning) in enterprises…

ERP stands for Enterprise Resource Planning, which is an…

According to the provisions of Article 15 of Circular…

The latest information on the application of electronic invoices…
The company is using paper invoices, will it be…

Many people default to Sundays or public holidays as…

Are vacation and travel expenses subject to PIT? If…

Excluded expenses when calculating corporate income tax is a…